Education
PhD, Computer Graphics & Data Visualization
Committee: Kate Isaacs, Alberto Cairo, Chris Johnson, Marina Kogan, JoAnn Kuchera-Morin
MCS, Computer Science
BS, Computer Science
Internships
Camera & Photos Intern
- TBD.
HCI & Visualization Intern
- Researched and prototyped AI presence in 3D authoring tools, resulting in a provisional patent.
Graphics Intern → Associate Graphic Editor
- Contributed to award-winning data journalism and spatial visualization using machine learning and computer vision technologies.
Work Experience
Founding Director, Visualization Program Office (2022–2024)
- Responsible for leadership and management of strategic directions and activities for 37 staff.
- Identified new collaboration and funding opportunities. Wrote $60 million in proposals in 2023.
- Managed staff working on multiple parallel projects. Led diverse team members with expertise spanning the spectrum of technology to design, and fields ranging from astronomy to genomics.
Director, Advanced Visualization Lab (2021–2024)
- Led a team of designers and research software engineers in creating cinematic scientific visualizations which reach millions of viewers worldwide through films, museums, concerts, and social media.
Jr. → Sr. → Principal Research Software Engineer (2014–2022)
- Wrote software, machine learning models for image processing and AI-assisted design, C++ Houdini plugins, Python and Bash scripts to support pipelines, and web programming as-needed.
- Developed internal and open-source software, such as Ytini which has 10,000 users.
- Processed, cleaned, transformed, and wrangled big data of sizes 50GB – 50TB.
- Created supercomputer pipeline tools for seamless rendering of ~15,000 node-hours per day.
Adjunct Professor
- Taught BDI 513: Storytelling with Data, a graduate-level data visualization course, to 75 students.
Software Engineer
- Developed full-stack for web applications used by 98% of hospitals nationwide.
- Single-handedly programmed Android app which was used by 500,000 medical professionals.
Co-Founder & Android Developer
- Developed an Android app for real-time visualization of stock market data.
Graphics for Film and Event Productions
Selected large-scale cinematic scientific visualization productions based on real scientific datasets, often accompanying peer-reviewed research and public science communication.
Select Software Projects
Open-source middleware between the scientific analysis/visualization Python package, yt, and the 3D animation software, Houdini.
A computer vision system for large-scale audience interaction with graphics at large events. Patent pending.
A pipeline and resource-managing tool for supercomputer rendering.
The Houdini-AVL Interface, a Houdini HDK scientific data visualization C++ plugin.
The Laboratory for Audience Interactive Technologies (LAIT) mobile app for use by audiences during live performances.
A VR app for previewing fulldome content in virtual reality.
An Android app to find medical codes installed by ~500,000 users.
A web-based tool for doctors to use to drill-down and track diagnoses.
Publications
Research Papers
Naiman, J., Aria, Zhao, H., Christensen, A.J., Borkiewicz, K., Srikanth, S.
WebSci 2025.
Jensen, E., Borkiewicz, K., Carpenter, J., Levy, S., Naiman, J.
International Journal of Science Education.
Jensen, E., Borkiewicz, K., Naiman, J., Levy, S., Carpenter, J.
PLOS One.
Jensen, E., Borkiewicz, K., Naiman, J., Levy, S., Carpenter, J.
MDPI Sustainability.
Jensen, E.J., Borkiewicz, K., Naiman, J.
Frontiers in Science & Environmental Communication, 7.
Borkiewicz, K., Shah, V., Naiman, J.P., Shen, C., Levy, S., Carpenter, J.
IEEE Visualization Conference 2021 papers.
Sener, M., Levy, S., Stone, J. E., Christensen, A. J., Isralewitz, B., Patterson, R., Borkiewicz, K., Carpenter, J., Hunter, C. N., Luthey-Schulten, Z., Cox, D.
Parallel Computing.
Aleo, P. D., Lock, S. J., Cox, D. J., Levy, S. A., Naiman, J. P., Christensen, A. J., Borkiewicz, K., Patterson, R.
Astronomy And Computing, 33.
Borkiewicz, K., Naiman, J. P., & Lai, H.
The Astronomical Journal, 158(1), 10.
Naiman, J. P., Borkiewicz, K., & Christensen, A. J.
Publications of the Astronomical Society of the Pacific, 129(975), 058008.
Peer-Reviewed Work in Conference Proceedings
Borkiewicz, K., Riedemann, L., Patanjali, K., Elkins, K.
ACM SIGGRAPH 2024 Panels.
Borkiewicz, K., Fidrick, D., Thompson, B.
ACM SIGGRAPH 2024 Production Sessions.
Jensen, E., Borkiewicz, K., Naiman, J.P., Carpenter, J.
ACM SIGGRAPH Asia 2022 Courses.
Borkiewicz, K., Levy S., Carpenter, J., Cox, D., Patterson, R., Christensen, A.J.
Supercomputing Conference 2022.
Borkiewicz, K., Levy, S., Carpenter, J., Cox, D., Patterson, R., Christensen, A.J.
IEEE Visualization Conference 2022 Viz4Climate.
Borkiewicz, K., Levy, S., Carpenter, J., Patterson, R., Christensen, A.J.
ACM SIGGRAPH 2022 Production Sessions.
Jensen, E., Borkiewicz, K., Naiman, J.P., Carpenter, J.
ACM SIGGRAPH 2022 Courses.
Borkiewicz, K., Christensen, A. J., Wyatt, R., Wright, E.
ACM SIGGRAPH 2020 Courses.
Borkiewicz, K., Christensen, A. J., Shirah, G., Elkins, K., Berry, D., & Fluke, C.
ACM SIGGRAPH Asia 2019 Courses.
Sener, M., Levy, S., Christensen, A. J., Patterson, R., Borkiewicz, K., Stone, J.E., Isralewitz, B., Carpenter, J., & Cox, D.
Supercomputing Scientific Visualization Showcase.
Borkiewicz, K., Christensen, A. J., Kostis, H.N., Shirah, G., & Wyatt, R.
ACM SIGGRAPH 2019 Courses on - SIGGRAPH 19.
Borkiewicz, K., Christensen, A. J., & Stone, J. E.
SIGGRAPH Asia 2017 Courses on - SA 17.
Borkiewicz, K., Cox, D., Patterson, R., Levy, S., Christensen, A. J., Carpenter, J. D., O'Shea, B.W., Wise, J.H., Xu, H., & Norman, M.L.
SC17 Scientific Visualization Showcase.
Borkiewicz, K., Cox, D., Patterson, R., Levy, S., Christensen, Carpenter, J. D., A. J., Goldbaum, N.J., Krumholz, M.R., & Forbes, J.C.
SC17 Scientific Visualization Showcase.
Borkiewicz, K., Christensen, A. J., & Stone, J. E.
ACM SIGGRAPH 2017 Courses on - SIGGRAPH 17.
Borkiewicz, K.
International Planetarium Society – IPS.
Posters
Shih, J. Y., Borkiewicz, K., Christensen, A. J., & Cox, D.
ACM SIGGRAPH 2019 Posters.
Borkiewicz, K., Jensen, E., Yiwen, M., Levy, S., Naiman, J.P., Carpenter, J., Isaacs, K.E.
IEEE VIS Posters.
Borkiewicz, K., Christensen, A. J., Levy, S., Patterson, R., Cox, D., & Carpenter, J.
SIGGRAPH Asia 2018 Posters.
Other Publications
Jensen, E.J., van Zeydam, E., Martin Segura, D.K., Borkiewicz, K.
Edward Elgar Publishing. Contracted, book writing in progress.
Huang, J., Lieberman, R., Borkiewicz, K., Cahalan, S., Corasaniti, N., Erden, B., Parlapiano, A., Walker, A.S., Wu, A., Yourish, K.
The New York Times.
Khurana, M., Borkiewicz, K., Shao, E., Erden, B., Wu, A., Saget, B.
The New York Times.
Erden, B., Khurana, M., Wu, A., Borkiewicz, K., Browning, K.
The New York Times.
Borkiewicz, K., Cai, W., Erden, B., Gamio, L., Gomez, M.G., Khurana, M., Saget, B., Ward, J., White, J.
The New York Times.
Borkiewicz, K., Cai, W., Erden, B., Gamio, L., Gomez, M.G., Khurana, M., Saget, B., Ward, J., White, J.
The New York Times.
Borkiewicz, K., Boyce, L., McCann, A., Gamio, L., Migliozzi, B. Kim, J., Lai, R., Park, A., Wu, A., Zhang, C.
The New York Times.
Borkiewicz, K., Jensen, E., Yiwen, M., Levy, S., Naiman, J.P., Carpenter, J., Isaacs, K.E.
Planetarian.
Jensen, E.J., Pfleger, A., Chen, T., Gerber, A., Rocha, J.N.
Frontiers in Communication.
Jensen, E.J., Borkiewicz, K., Naiman, J., Levy, S., Carpenter, J.
London School of Economics Impact of Social Sciences.
Borkiewicz, K., Jensen, E.J., Levy, S., Naiman, J., Carpenter, J.
London School of Economics Impact of Social Sciences.
Provisional Patents
Awards & Honors
Online Journalism Awards
WebSci'25 Conference
Work named in The New York Times's annual list
Jilin Animation Institute
University of Illinois at Urbana-Champaign
National Center for Supercomputing Applications
Certifications
Human Factors International
CITI Program
Award-Winning Films and Visualizations
Dome Fest West
Minsk Fulldome Festival
Supercomputing Conference
DTLA Film Festival
Reflections of the Universe Fulldome Festival
IPS Brno Fulldome Festival
Immersive Cinema Festival
Beijing Film Festival
 100% Tomatometer Rating, "A Beautiful Planet"
2017
100% Tomatometer Rating, "A Beautiful Planet"
2017
Rotten Tomatoes
Supercomputing Conference
Supercomputing Conference
Heartland Film
IPS Brno Fulldome Festival
Jena Fulldome Festival
Espinho Fulldome Festival
Additional Visualization and Film Festival Selections
 "Flight to Galactic Center Stellar Orbits"
 2024
2024
Ars Electronica
"Flight to Galactic Center Stellar Orbits"
2023
Supercomputing SciVis Showcase
"Vavilov Ice Cap Collapse"
2023
Supercomputing SciVis Showcase
"Vavilov Ice Cap Collapse"
2022
SIGGRAPH Electronic Theater
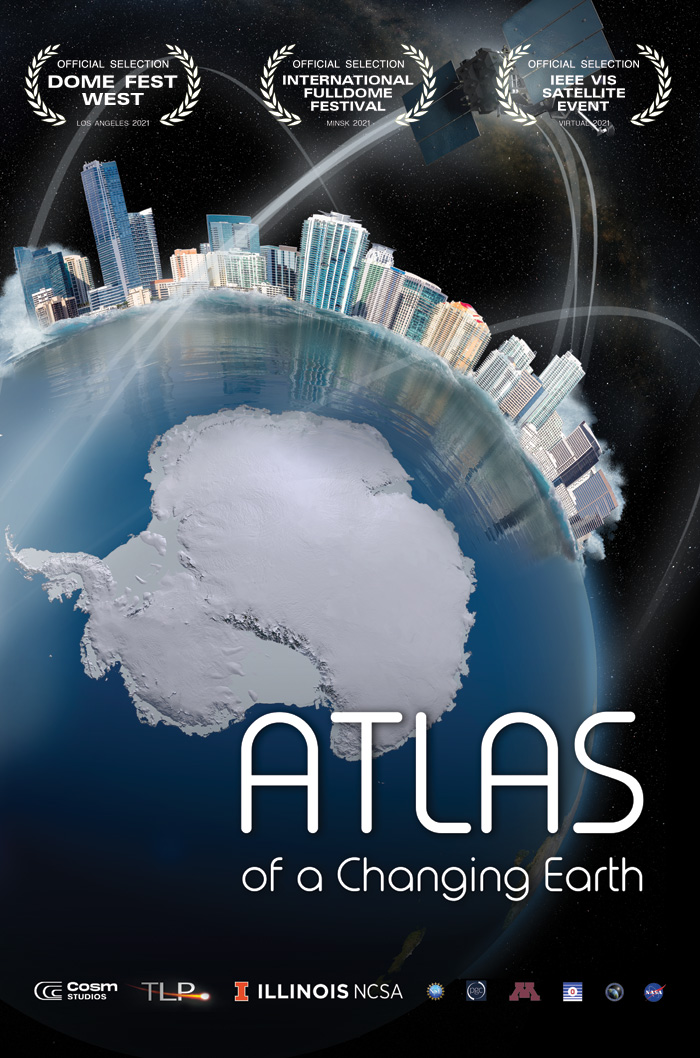
"Atlas of a Changing Earth"
2022
Best of Earth Fest
"Atlas of a Changing Earth"
2021
Minsk Fulldome Festival
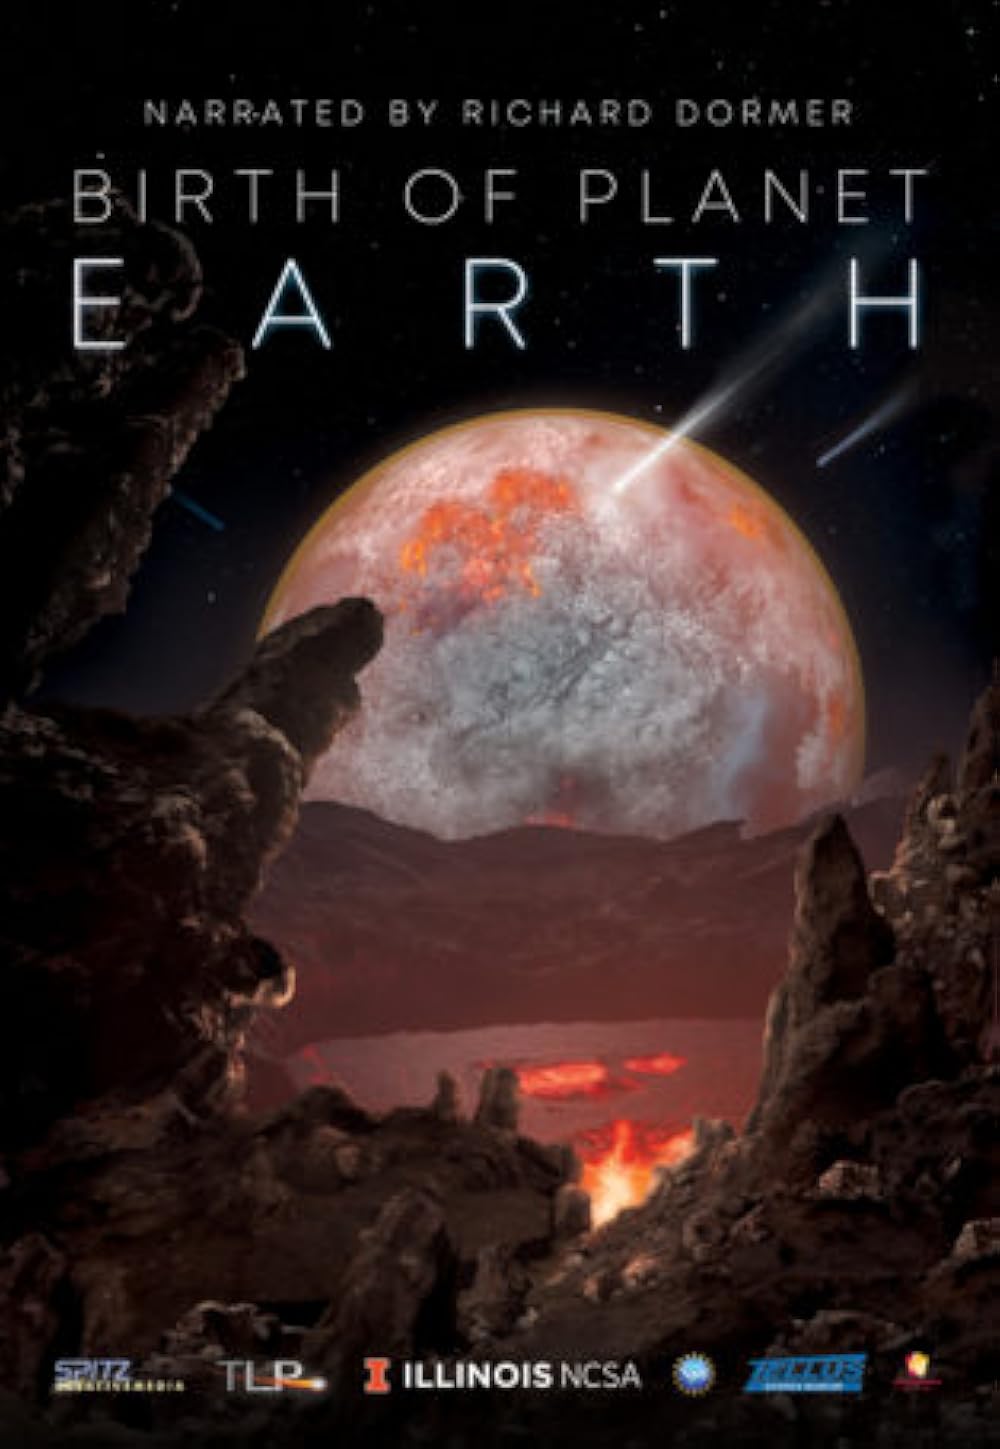
"Birth of Planet Earth"
2021
Kaluga Russia Fulldome Festival
"Birth of Planet Earth"
2021
Minsk Fulldome Festival
"Birth of Planet Earth"
2020
Korean Fulldome Festival
"Birth of Planet Earth"
2020
Dome Under Festival
"Birth of Planet Earth"
2020
Immersive Film Festival
"Birth of Planet Earth"
2019
Astra Film Festival
"Birth of Planet Earth"
2019
Macon Film Festival
"The Collision that Formed the Moon"
2019
SIGGRAPH Asia Computer Animation Festival
"Photosynthesis in a Chromatophore"
2019
SIGGRAPH Asia Electronic Theater
"Photosynthesis in a Chromatophore"
2019
SIGGRAPH Electronic Theater
"Solar Superstorms"
2018
Macon Film Festival
"Solar Superstorms"
2017
Astra Film Festival
"Solar Superstorms"
2017
SIGGRAPH Electronic Theater
"Solar Superstorms"
2016
Gwacheon International Film Festival
Mentored Students' Awards
Y. Miao, K. Deng, Y. Zhao, K. Haas, C. Santo, C. Wehmeier, Q. Herzig
Jasmine Shih
Dawn Nguyen
Service
Committee Positions
Peer Reviewing
Select Grants as PI or Senior Personnel
$3,746,585 from DOE
$300,000 from Illinois Computes for visualization projects with researchers on UIUC campus
$1,066,000 from NIH through the Center for C. Elegans Anatomy
$15,000,000 from NSF to create Institute for Geospatial Understanding through an Integrative Discovery Environment
$240,000 from Brinson Foundation for research on how design choices affect audiences viewing visualization, and supermassive black hole visualization
1,500,000 hour allocation on the Blue Waters supercomputer ($142,335 value)
Presentations
Teaching
University of Utah
University of Illinois at Urbana-Champaign (UIUC)
4 week online course with 5,000 students, UIUC
Guest Lectures
University of Colorado Boulder
University of Utah
University of Illinois at Urbana-Champaign (UIUC)
UIUC
UIUC
UIUC
Online course, UIUC
UIUC
UIUC
Invited Talks
Cornell University's Computer Vision & Graphics Research Initiative
Autodesk Research
University of Oklahoma
Southwest Jiatong University
Chengdu Academy of Fine Arts
Jilin Animation Institute
The New York Times
The New York Times
Flatiron Institute
The New York Times
Vienna University of Technology
The Ohio State University
Hong Kong ACM SIGGRAPH Chapter
L'Oreal Research
UC Santa Cruz
SIGGRAPH Sparks
I-GUIDE
US National Congress, Theoretical & Applied Mechanics
University of Pennsylvania
ACM Chicago
University of Illinois
University of New South Wales, Sydney, Australia
World Premiere at Zeiss Großplanetarium, Berlin, Germany
Conferences, Workshops, & Panels
American Geophysical Union
IEEE VIS Satellite capstone at the University of Utah
ACM SIGGRAPH
AESIS
Supercomputing
International Visual Literacy Association Conference
NASA's Universe of Learning AstroViz Meetup
ClearObject
SIGGRAPH
Research Impact Summit
University of Pennsylvania
Houdini.School
NVIDIA GTC
LSSTC Data Science Fellowship Program workshop
IEEE VIS
ACM SIGGRAPH
ACM SIGGRAPH Asia
ACM SIGGRAPH Asia BOF
Broadening Participation in Visualization
Broadening Participation in Visualization
Data Visualization and Exploration in the LSST Era
IMERSA
Webinar with 34,000 views, University of Illinois
ACM SIGGRAPH BOF
ACM SIGGRAPH
ACM SIGGRAPH BOF
ACM SIGGRAPH BOF
ACM SIGGRAPH BOF
Outreach and Public Talks
Taft High School
Women in Computer Science
Wonder & Skepticism, Chicago, IL
Northside College Preparatory High School
TEDxUIUC Salon on Women in STEM, University of Illinois
Press
Scientific Computing and Imaging Institute press
ACM SIGGRAPH podcast
ACM SIGGRAPH blog
ACM SIGGRAPH podcast
NCSA Press
Smile Politely
Animation Magazine
HPC Wire
NCSA Press
HPC Wire
ACM SIGGRAPH podcast
HPC Wire
Planetarian Magazine
NASA Features
Research Software Engineer Stories Podcast
Houdini.School
ACM SIGGRAPH Blog
Chicago Tribune
Planetarian Magazine
Planetarian
HPC Wire
SideFX Stories
The Hoof Beat Northside College Prep High School newspaper
NCSA Press
The Daily Illini
The News-Gazette
Skills
Python, C++, Java, C#, JavaScript, HTML/CSS, Bash, .NET
Houdini, Tableau, yt, Nuke, Unity, Adobe Premiere Pro, Adobe Photoshop
English (fluent), Polish (fluent), Spanish (conversational), American Sign Language (beginner)
USA, Poland
Computer graphics, scientific visualization, information visualization, data visualization, human-computer interaction, computational photography, computer vision, film production, pipelines, augmented reality (AR), machine learning, user experience (UX) design, graphic design, information design, science communication, science education, informal education, public speaking, interdisciplinary collaboration